

Market research · 23 July 2026 · 12 min
Dubai market pulse: monthly, quarterly and historical signals
A research dashboard separating monthly momentum, quarterly residential activity and the longer registered-transaction cycle—without mixing unlike definitions.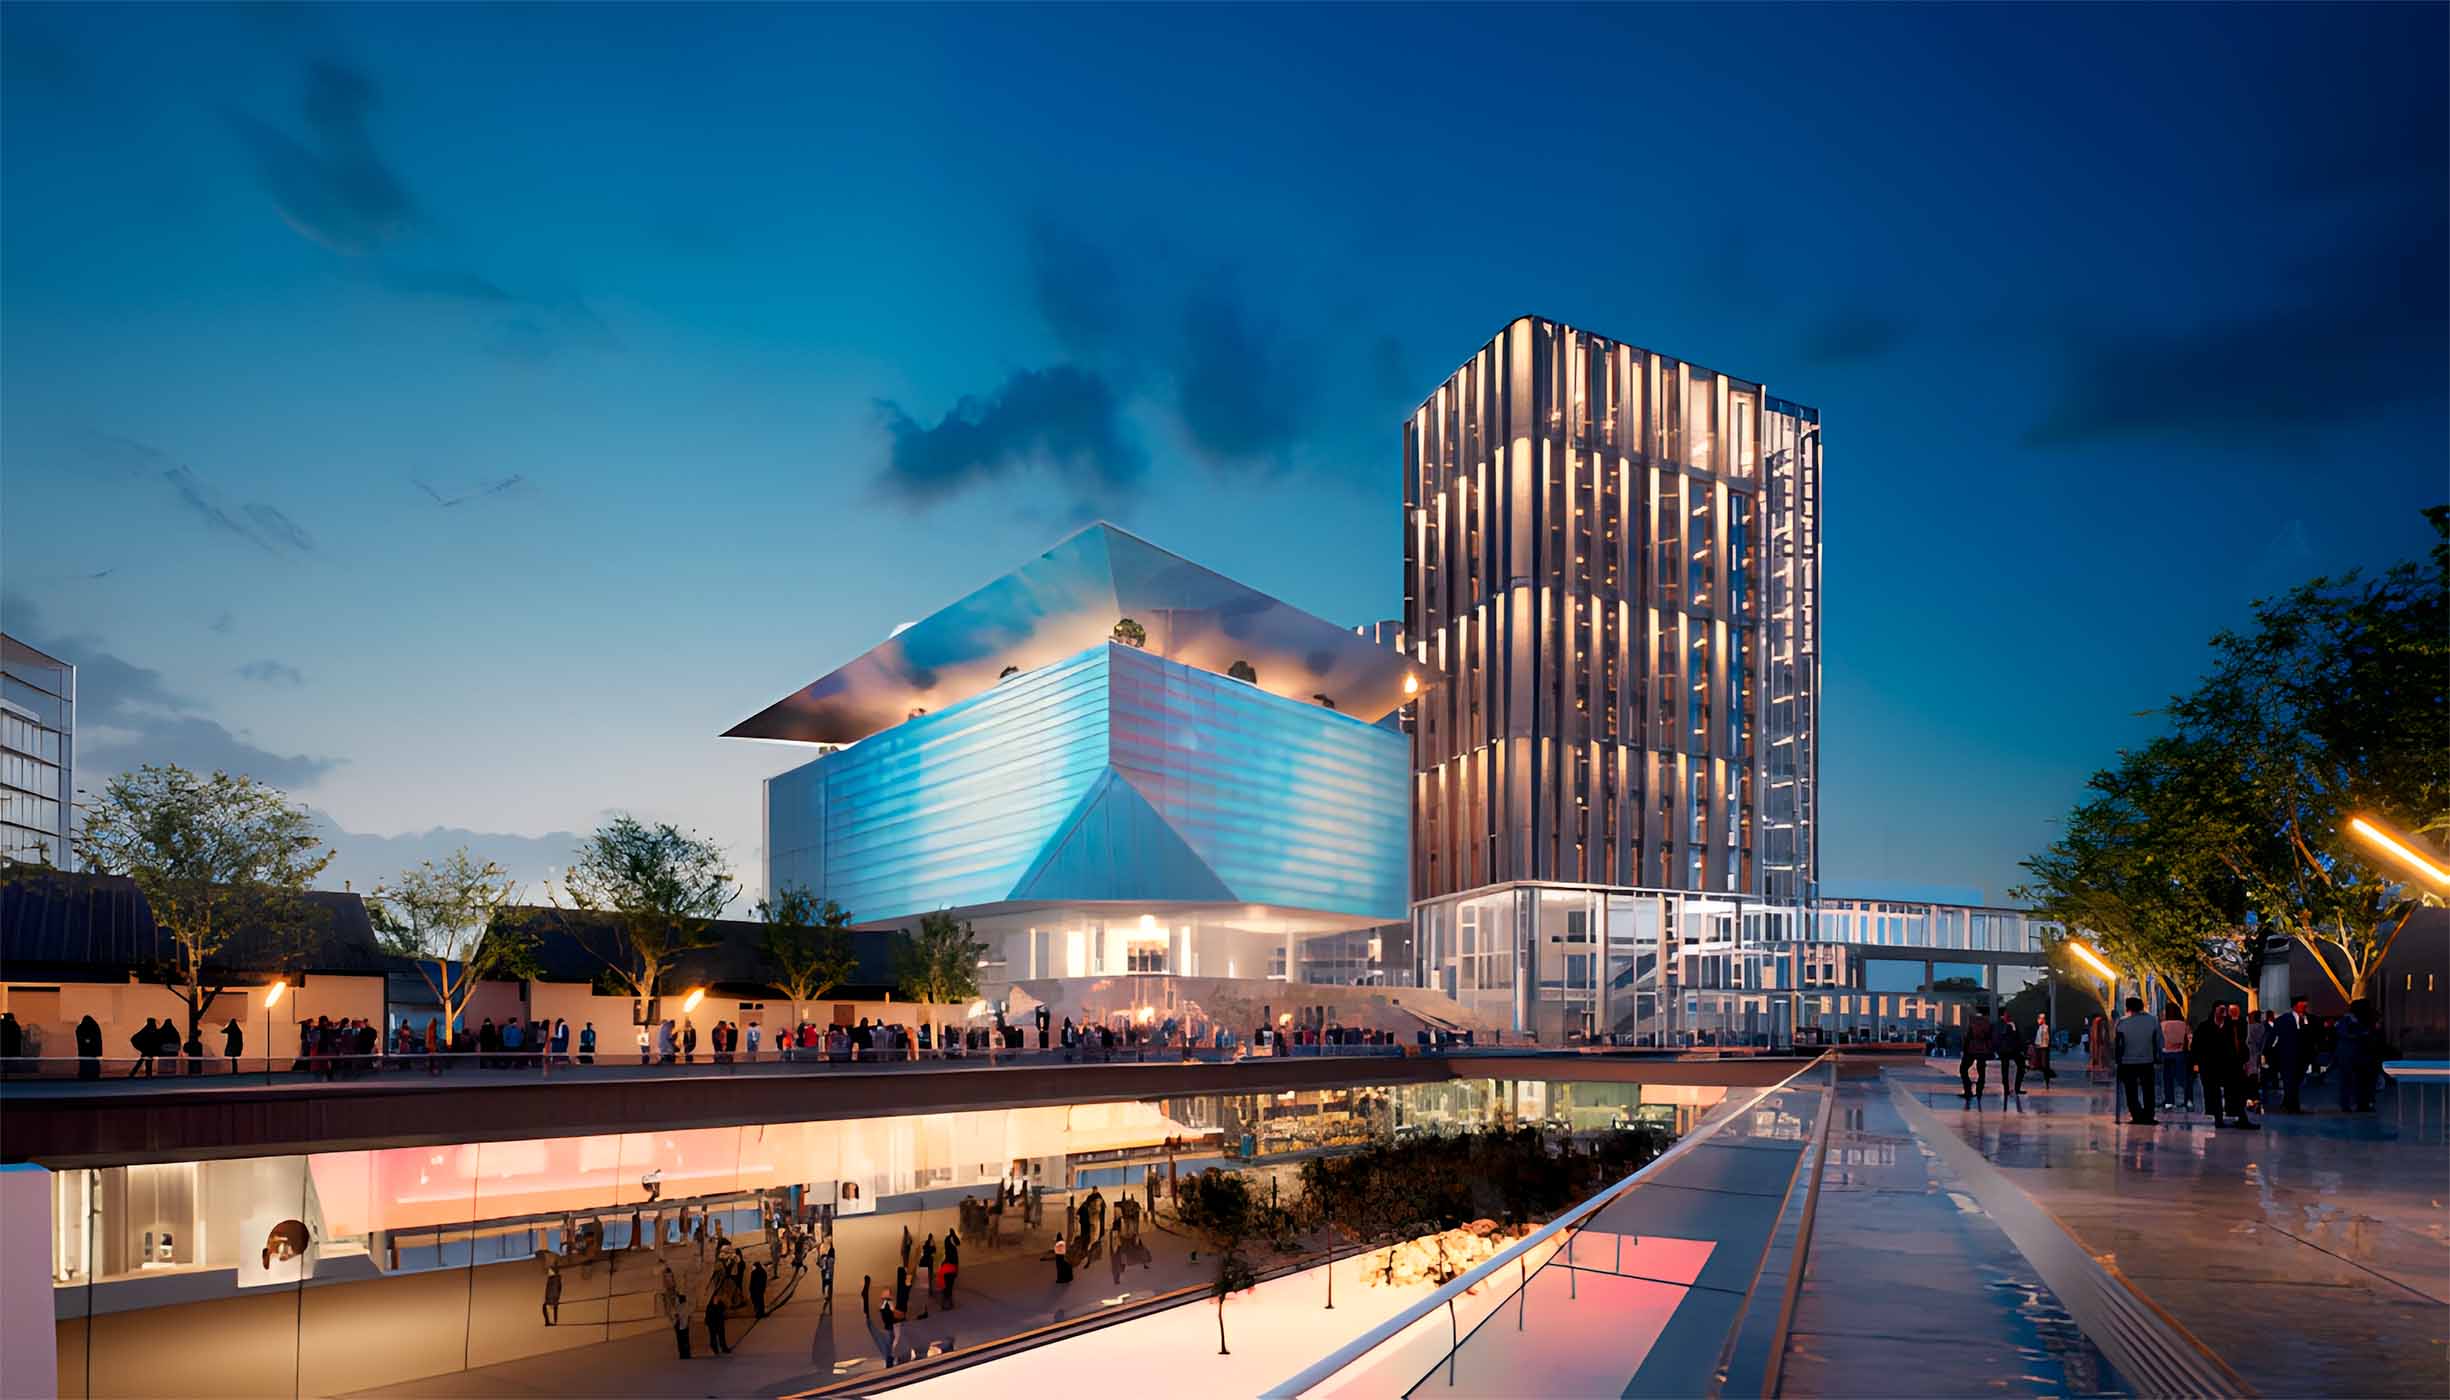
Evidence dashboard
Read the signal.
Keep the definition.
Monthly pulse
Activity slowed sharply in March, without erasing Q1 growth
The first two months averaged 16,100 residential sales. March recorded 12,900 as the regional conflict interrupted momentum; the quarter still finished 4% above Q1 2025 by volume.
Quarterly comparison
Residential sales value remained above the prior-year quarter
Q1 2026 residential sales reached AED 143.1 billion, a reported 22.2% increase from Q1 2025 despite a more selective finish to the quarter.
Historical depth
Registered real-estate transaction value expanded across four years
Dubai Land Department’s all-market series includes sales, mortgages and other registered real-estate transactions. It should not be compared directly with residential-sales-only charts.
Start by defining the dataset
Market totals differ because Dubai Land Department’s broad real-estate transaction series includes categories beyond residential sales, while residential research reports isolate a narrower set of transfers. DXB Interact also separates sales from mortgage registrations and excludes gift transfers from its sales measures. A credible trend begins by keeping those definitions visible.
The monthly, quarterly and annual charts in this briefing are therefore presented as separate analytical lenses. Their direction can be compared; their absolute totals should not be combined into one series.
Monthly momentum changed inside the quarter
Emirates NBD Research reported an average of 16,100 residential transactions in each of January and February 2026, followed by 12,900 in March. That is a clear interruption to momentum, consistent with buyers taking more time during conflict-related uncertainty.
The same report records more than 45,200 transfers across Q1, 4% above the prior-year quarter. This combination matters: a market can slow sharply at the margin while the full quarter remains positive. Investors should watch subsequent monthly registrations before declaring either a permanent reversal or an immediate recovery.
Quarterly value was supported by mix as well as volume
Engel & Völkers reported AED 143.1 billion of Q1 2026 residential sales across 44,743 transactions, with value up 22.2% and volume up 4.6% year on year. Off-plan represented 67.3% of transactions, keeping project selection, developer execution and completion supply central to the risk assessment.
Higher transaction value with slower volume growth can reflect price movement, larger-ticket sales or a changing product mix. It is not sufficient evidence that every segment appreciated at the same rate.
The historical curve shows scale—and the need for discipline
Dubai Land Department reported all-market registered transaction value of about AED 300 billion in 2021, AED 528 billion in 2022, AED 634 billion in 2023 and AED 761 billion in 2024. The expansion demonstrates market depth, capital formation and a larger institutional framework.
Scale can improve liquidity and data visibility, but it can also coexist with local oversupply. The practical investment test remains asset-level: achieved price per square foot, comparable rent, handover concentration, service cost, financing exposure and exit depth in the exact community.
A monthly research routine
Track completed and off-plan sales separately; compare registrations with launches and handovers; watch the spread between asking and achieved prices; and review new versus renewed tenancy contracts. Record both volume and value because one can rise while the other weakens.
At quarter-end, rebuild the view by community and ticket size. Citywide averages are a context layer, not a substitute for a comparable-sales set around the property being considered.
Research sources
DXB Interact: transaction-data methodologyEmirates NBD Research: Dubai Residential Review Q1 2026Engel & Völkers: Dubai Residential Report Q1 2026Dubai Land Department: Real Estate Sector Performance 2024This content is general market information, not a promise of returns or personal financial advice. Verify live inventory, contracts, fees and eligibility before committing capital.